Analyst Targets
- TD Cowen: Buy, $485 (Oct. 8, 2026)
- Tigress Financial: Buy, $485 (Sept. 17, 2026)
- Evercore ISI: Outperform, $450 (Sept. 16, 2026)
- Wells Fargo: Overweight, $417 (Oct. 6, 2026)
- JPMorgan: Overweight, $420 (Jul. 23, 2026)
Every one of those targets was set before last night’s report. Most sit 40% or more above where GOOGL is trading this morning.
What Happened
Alphabet’s Q3 results, released after Wednesday’s close, produced the company’s first top-and-bottom-line miss in nearly four years. EPS came in at $2.12 against a $3.01 consensus, a gap of nearly $0.89 per share. Revenue of $127.58 billion trailed the $127.97 billion estimate. Shares fell roughly 10% in after-hours trading to around $290, erasing gains accumulated through October.
The headline EPS number is partly, but not entirely, an accounting artifact. An $8.7 billion unrealized loss on Alphabet’s equity investments, a reversal from a gain a year ago, dragged net income to $26.2 billion from $35.0 billion a year ago and cut EPS by $0.55. Strip it out and the miss is narrower, but the cash flow problem remains fully real.
The Numbers
- Revenue: $127.58B, +25% year-over-year; missed $127.97B estimate
- GAAP EPS: $2.12 vs. $3.01 expected; $2.87 a year ago
- Operating income: $40.6B, +30%; operating margin 31.8%
- Google Search: $63.35B, +12% YoY; missed $64.96B estimate
- Google Cloud: $30.71B, +103% YoY; beat $28.7B estimate; Cloud operating margin 36.2%
- YouTube ads: $11.2B, +9%
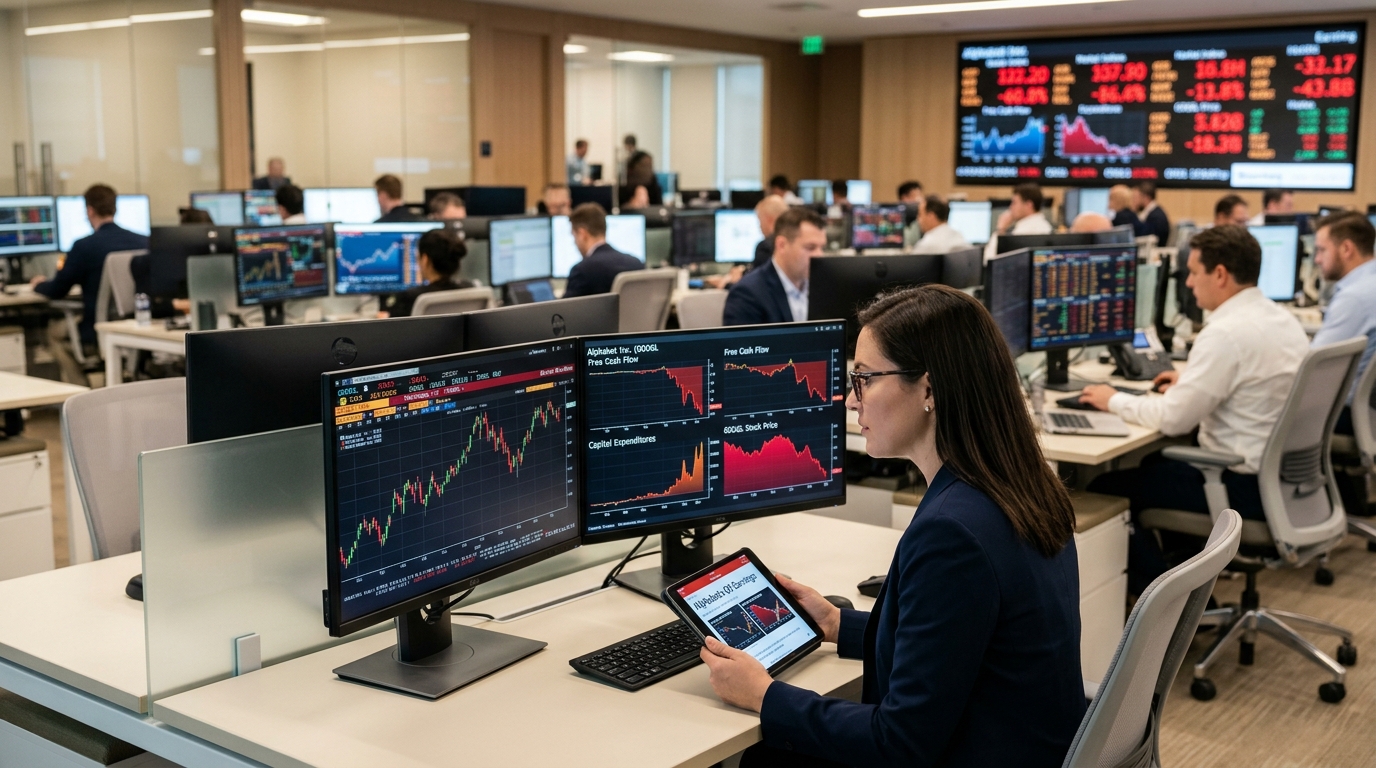
- Capital expenditures: $51.4B in Q3
- Free cash flow: negative $9.1B
Why the Stock Is Moving
Two numbers closed the debate. First, Search. At $63.35 billion, growth slowed to 12% from 17% in Q2, missing by $1.6 billion. For a company whose entire valuation thesis rests on durable search dominance, a deceleration of that magnitude, however modest in percentage terms, is the line that gets circled in red.
Second, and more structurally damaging, is the cash flow. Capex of $51.4 billion against operating cash flow of $42.3 billion produced negative free cash flow of $9.1 billion. Management was explicit on the call: capital expenditures are expected to increase significantly again in 2027, with more detail slated for the Q4 discussion.
The market is not pricing the quarter. It is pricing what the trajectory implies: a company spending at roughly 40 cents of every revenue dollar on capital infrastructure, with no near-term return to positive free cash flow in sight.
Macro Context
Alphabet is not an isolated case. The hyperscaler cohort, Microsoft and Meta included, is running the same playbook: revenue up, cash flow structurally pressured by AI infrastructure. What separates Alphabet is that its primary revenue engine, Search, is simultaneously showing deceleration. If AI-driven query growth, which management characterized as the highest in five years, is not translating into ad revenue at the pace the street expects, the return-on-investment argument for the capex cycle becomes harder to make.
Google Cloud’s 103% growth is genuine. The cloud business is building real, monetizable AI infrastructure demand. But it cannot, at current margins, offset a $9-billion cash shortfall in a single quarter.
Forward Scenarios
Bull: $325
Cloud sustains triple-digit growth into Q4, Search reaccelerates as AI query monetization improves, and equity investment losses reverse. FCF remains negative but the trend narrows. Multiple expansion resumes on the premise that capex peaks in 2027.
Google Cloud’s trajectory does not exist in isolation. OpenAI’s decision to distribute GPT-6 natively across all three major cloud providers simultaneously reshapes how enterprise buyers choose infrastructure.
Base: $290–$300
Shares consolidate near current after-hours levels as the market waits for Q4 capex specifics. Cloud growth continues above 80%, but Search stays in the 10%–13% band. FCF remains negative. Multiple compression continues until a credible 2027 spending ceiling is provided.
Bear: $266
Search growth slips further, Q4 commentary points to another step up in 2027 spending without a matching improvement in monetization, and equity investment marks worsen. The 52-week low comes back into view.
Technical Overlay
GOOGL closed Wednesday at $324.89 and traded down to roughly $290 after hours. That gap takes the stock below two technically significant levels analysts had flagged: $315 prior support and $297. The 52-week range is roughly $268 to $409. Buyers need a close back above $325 to neutralize the gap. Until that happens, the path of least resistance is toward the $266 floor.
Bottom Line
The EPS miss is partly explainable. The Search miss is not. And the free cash flow result is neither a one-quarter aberration nor a rounding error: it reflects a deliberate, management-endorsed capital allocation choice that will intensify in 2027. The question investors must answer today is not whether Google Cloud is growing. It clearly is. The question is whether a business spending at this scale, with free cash flow turning negative, deserves a premium multiple while its most profitable legacy segment decelerates. That is the argument the stock is now having with itself at about $290.