July 11, 2026
Intel Is Down 21% in 7 Days. July 23 Will Define What Comes Next.
Featured Offer: Cytonics
Big Pharma’s $560B White Flag is One Startup’s Ticket
Big Pharma spent decades and $1B trying to solve osteoarthritis. They kept failing because they only targeted one of the many culprits attacking joints. Cytonics figured that out.
They created the first therapy with the potential to address the root cause at the molecular level, already proven across 10,000+ patients. Now they’re pushing toward FDA approval on a version that’s 200% more potent, backed by $32M raised and partnerships with Stanford and Scripps Research.
Invest in Cytonics before this month’s deadline.
This is a paid advertisement for Cytonics Regulation CF offering. Please read the offering circular at https://cytonics.com/
Forward-looking statements are subject to risks and uncertainties. There is no guarantee of performance. Past performance does not predict future results. All investments involve risk, including loss of principal.
FEATURED
Intel Is Down 21% in 7 Days. July 23 Will Define What Comes Next.
Intel had one of the strongest first halves of any major semiconductor stock in 2026. The stock climbed from around $38 at the start of the year to a 52-week high of $142.35, a run of roughly 278% year-to-date by late June. It looked like one of the more remarkable corporate reversals in chipmaking in recent memory.
Then the floor opened up.
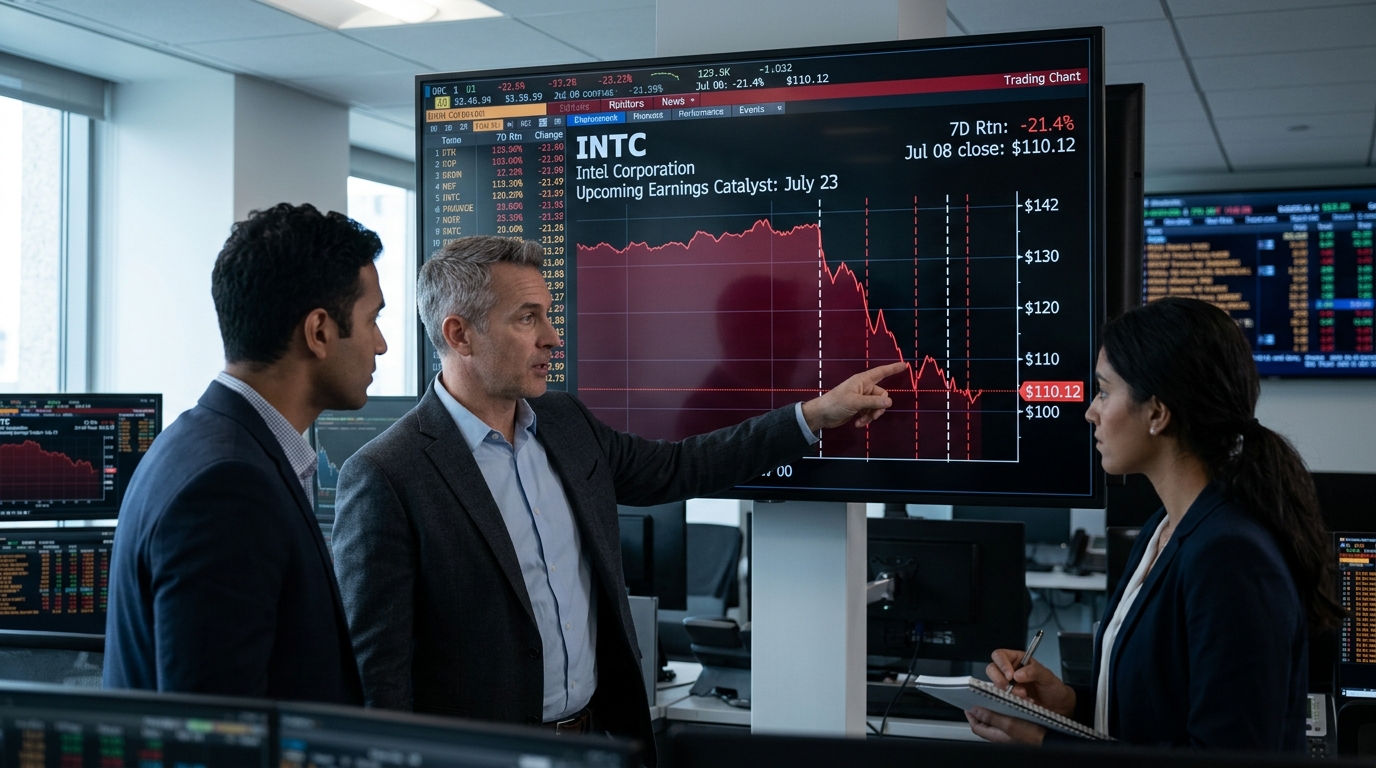
By July 8, INTC had dropped to around $110, a loss of roughly 21% across seven trading days. And that happened while the broader market held up. This was not a macro selloff. It was surgical, hitting Intel specifically across three distinct pressure points in the same week.
Analyst Targets
- HSBC: Buy, $200 target (raised from $100) — long-term foundry thesis intact, citing hyperscaler AI demand and domestic chip production tailwinds
- Goldman Sachs: Neutral, $150 target — initiated June 25, flagging significant upside optionality from foundry advanced packaging, projected to reach $10B in revenue by 2030
- Bank of America: Originally flagged AI semiconductor valuations as stretched in a July 1 note, triggering the initial leg of the selloff. Current consensus analyst average target sits near $98, well below where the stock trades
- Cantor Fitzgerald: Neutral, raised to $150 from $90, citing expected growth in AI infrastructure scale over the coming years
Three Catalysts, One Week
The selling started July 1 when Bank of America warned that AI semiconductor valuations had become too stretched. That alone knocked Intel down over 8%. Then came the sector-wide pressure. Then came the company-specific news that really did the damage.
Reports circulated that Intel’s 18A manufacturing process is unlikely to reach profitable yields until late 2026 or possibly 2027. That single piece of information hit the stock for nearly 10% on July 7 alone, because the entire foundry bull case is built around a specific timeline assumption: that 18A inflects meaningfully in 2026.
The third leg was competitive. AMD posted $5.8 billion in data center revenue in Q1 2026, edging past Intel’s $5.1 billion in the same segment. AMD has been building that lead since Q3 2025. It is not a rounding error. It is a structural marker that the data center is no longer Intel’s uncontested territory.
The Foundry Math Right Now
Here is what the numbers actually say. Intel Foundry generated just $174 million in external customer revenue in Q1 2026, against total foundry segment revenue of $5.4 billion and a $2.4 billion operating loss in that same segment. The foundry is still overwhelmingly an internal supplier to Intel’s own chip designs.
That distinction matters. Manufacturing chips for Intel validates the technology. But the economics of a foundry only improve when external customers trust the process enough to commit meaningful production volumes. Right now, external revenue is a fraction of the total.
Intel’s Q1 2026 headline numbers were actually strong. Revenue landed at $13.6 billion, approximately $1.4 billion above the midpoint of guidance. The Data Center and AI segment grew 22% year-on-year to $5.1 billion. Non-GAAP EPS came in at $0.29 against a Street consensus of roughly $0.01. Intel has exceeded revenue estimates in six consecutive quarters. The business itself is recovering. The July selloff is almost entirely a market reassessment of what the foundry is worth if the profitable yield timeline slips by even one to two quarters.
What Q2 Needs to Show on July 23
Intel guided Q2 revenue to a range of $13.8 to $14.8 billion, with a midpoint of $14.3 billion. Non-GAAP EPS guidance is $0.20. Non-GAAP gross margin guided to 39%. Analysts are watching three specific things in that report:
- External foundry revenue trajectory — flat or declining confirms the bear case; any sequential step-up changes the conversation meaningfully
- Non-GAAP gross margin — management guided Q2 to 39%, down from Q1’s 41%, flagging 18A ramp costs as the headwind. Holding above 38% suggests the recovery is on track
- What CEO Lip-Bu Tan says about profitable 18A yield timelines — this is the binary. A confirmed H2 2026 milestone with specific data makes the selloff look like an overreaction. A push to 2027 validates the bears.
Forward Scenarios
Bull: July 23 shows external foundry revenue accelerating, management reaffirms H2 2026 profitable yield milestone with specifics, gross margin holds at or above 39%. Stock reclaims $125 and runs toward the $141 prior high, with a credible path to $150-200 if foundry execution becomes believable on a 12-month horizon.
Base: Q2 beats the modest EPS bar, revenue comes in near the $14.3B midpoint, but 18A timeline commentary remains vague. Stock stabilizes in the $110-$125 range as investors adopt a wait-and-see posture into H2 data.
Bear: Margin misses the 38% floor, external foundry revenue stalls, and management acknowledges 2027 as the realistic yield timeline. The $108.60 support level breaks on volume, and the next reference point is $100, then the low $90s.
Technical Overlay
Intel is holding just above its 200-day EMA near $108.60. That is the line. The RSI sits near 37-38, approaching but not yet at oversold territory. A close below $108.60 on heavy volume opens a path toward $100 with limited technical support between those two levels. Reclaim $125.70 on a daily close, and the base case target is $141.
What Actually Matters Here
Intel ran nearly 280% year-to-date into its June peak. That kind of move prices in a very specific future. When any part of that future slips by even one quarter, the correction is violent because the multiple was built on certainty that no longer exists.
The July selloff is the market reassigning probability to the foundry timeline, not concluding that the business has failed. Intel still has six consecutive revenue beats, a rebuilding balance sheet backed by NVIDIA’s $5B equity stake and SoftBank’s $2B investment, and a Data Center and AI segment growing at 22% year-over-year. The core business is moving in the right direction.
The question for July 23 is not whether Intel had a good Q2. It probably did. The question is whether management can restore enough confidence in the 18A timeline to justify a stock that, even after a sharp drop, still trades well above where the average analyst has a target.
That is a high bar to clear in one earnings call.
For informational purposes only.