

July 18, 2026
Your money is changing.
For the first time in half a century, the U.S. dollar is being reset.
The last time this happened was 1974, when Henry Kissinger anchored the dollar to Saudi oil and set in motion the greatest accumulation of wealth in the history of the world.
It cleaved a sharp dividing line through this country. Between the families who built fortunes that lasted for generations, and the families who were quietly left behind.
I believe that same line is being drawn right now.
And what you do in response could decide which side you and your family ends up on.
My name is Porter Stansberry, and I’ve spent the last thirty years studying how enormous shifts in the global economy create – and destroy – wealth.
In 2006, I warned my readers about the looming collapse of Fannie Mae and Freddie Mac – years before it brought the American banking system to its knees.
In 2008, I told them to buy gold and silver. Both more than doubled while the dollar’s purchasing power collapsed.
And in 2020, I warned that the COVID-era money-printing would trigger the worst inflation in a generation. It did.
This foresight has helped my team and I anticipate some of the biggest moves in the capital markets – helping our readers take early positions in companies like Amazon, Adobe, Qualcomm, Regeneron, Intuitive Surgical, Meta, Shopify.
I’m writing to you today because I believe what is happening to the US dollar right now may be the most consequential financial story I have covered in my career.
After months of investigation, I am ready to expose, in full, President Trump’s monetary reset.
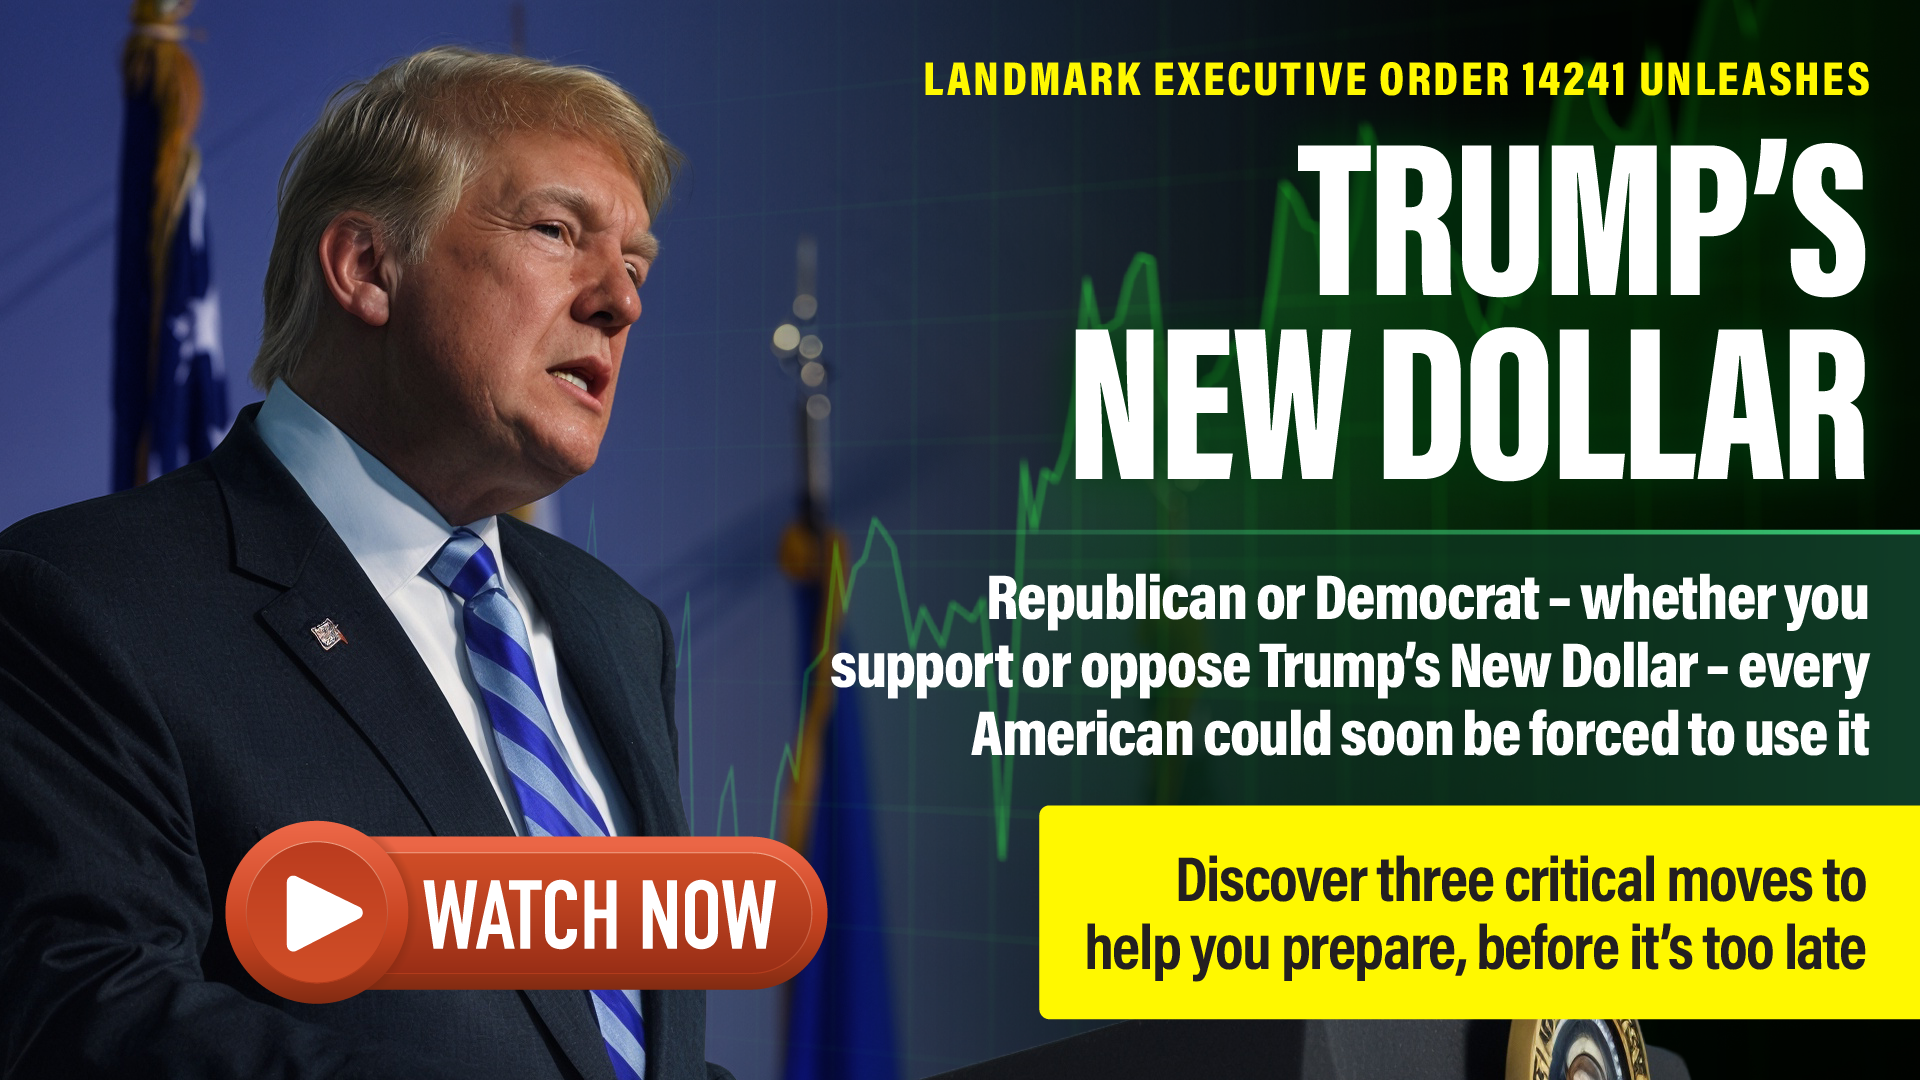
In my new documentary you’ll learn how the biggest change to America’s money in half a century is already underway…
How everything you’ve seen in the news over the past few years – the tariffs, the obsession with Greenland, the threats to annex Canada, the $1.4 trillion deal with the UAE, the disputes with China – all of it is connected to Trump’s New Dollar.
And you’ll also learn the specific steps I believe every American needs to take before a critical meeting of world leaders this December, which could change the U.S. dollar as you know it.
If you have money in the stock market or savings in the bank…
Find the time to watch it today.
Good investing,
Porter Stansberry
Amazon Is 12% Off Its High. July 30 Is the Only Number Left.

Here’s the part most investors skip when they look at Amazon right now.
The headline AWS number was excellent. Q1 2026 revenue hit $181.5 billion, up nearly 17% year over year. AWS specifically grew 28% year over year — its fastest pace in 15 quarters — with cloud revenue reaching $37.6 billion. EPS came in at $2.78 against a $1.65 consensus. By any surface read, this was a clean beat.
Then the stock gave back those gains and has been essentially flat for a month. AMZN is trading near $246, roughly 12% below its 52-week high, even as the underlying business is growing at the fastest cloud rate in nearly four years.
That gap is interesting. And July 30 is when it either closes or widens.
The Real Debate
Amazon is spending roughly $200 billion in capital expenditures in 2026. That figure covers data centers, networking infrastructure, and custom AI chips — including its Trainium and Graviton architectures. The consequence of that spending is visible in the cash flow statement: trailing 12-month free cash flow dropped to approximately $1.2 billion. That is a sharp decline.
Bulls argue this is the AWS founding story running again. In the early days of AWS, heavy infrastructure investment preceded years of compounding profit. Bears say the scale is different now and the payback period is uncertain. Both are reasonable positions.
What makes July 30 the actual catalyst is that this earnings report will be the first chance for management to show whether the capex is translating into accelerating revenue commitments — not just pipeline, but contracted backlog and real customer expansion.
What the Backlog Says
The AWS backlog stood at $364 billion in Q1 2026. That figure does not include the recently announced Anthropic deal, which Amazon said includes a commitment from Anthropic to spend more than $100 billion on AWS technologies over the next ten years. OpenAI has committed to 2 gigawatts of Trainium capacity through AWS infrastructure, with Trainium4 expected to begin delivery in 2027.
The argument management keeps making is that these are long-lived infrastructure assets being funded ahead of contracted revenue. The backlog supports that framing. The free cash flow number does not, at least not yet.
Analyst Consensus
- Wedbush: Initiated Buy, July 15, 2026
- Jefferies: Sees AMZN at a “one-third discount,” reiterated Buy
- New Street Research: 12-month target raised to $350 from $280
- TD Cowen: Buy, $350 target, citing AI-driven cloud workload expansion
- Consensus (41 analysts): Buy, average 12-month price target near $305–$313
The Q2 Setup
Amazon guided Q2 2026 net sales of $194 billion to $199 billion, with operating income of $20 billion to $24 billion. Prime Day moved into Q2 this year — a meaningful shift that makes the retail revenue comparison look better than the raw growth rate implies. AWS momentum, Prime Day pull-forward, and record advertising revenue all land in the same quarter.
Analysts expect revenue of approximately $196 billion and EPS around $1.82 for the quarter.
The number investors will actually care about is not those figures. It is whether AWS sustains or accelerates above 28% growth. That single data point validates or complicates the entire $200 billion capex plan.
Bull / Base / Bear
- Bull: AWS Q2 growth accelerates to 30%+. Free cash flow guidance inflects upward. AMZN breaks above $260 resistance and targets the $278–$296 range into year-end.
- Base: AWS holds at 28–29%, guidance is stable, free cash flow remains compressed. Stock consolidates near current levels. Long-term investors are patient; short-term traders stay frustrated.
- Bear: AWS growth decelerates below 25% as hyperscaler spending faces scrutiny. Free cash flow guidance disappoints. Stock breaks below $229 support and the capex debate turns aggressive.
Technical Overlay
AMZN is hovering near $246, having pulled back from its May peak near $278. Key technical levels to watch: a breakout above $260 opens the path toward $278 resistance. A close below $229 would invalidate the current structure and likely accelerate selling. The 50-day moving average is being tested. Options activity into July 30 has been notably elevated on the call side.
What Investors Should Watch
- AWS Q2 revenue growth rate — the single most-watched metric
- Free cash flow guidance for the second half of 2026
- Any update on Trainium customer adoption and backlog conversion
- Amazon Leo (satellite) commercial timeline
- Management tone on capex trajectory and payback timeline
Bottom Line
The debate on Amazon is not whether the business is good. It clearly is. The debate is whether $200 billion in annual infrastructure spending is priced correctly into a stock sitting 12% below its high while every analyst consensus points higher. July 30 does not solve that permanently — but it either adds fuel to the bull case or forces a harder conversation about when the free cash flow turns.
That is the only question that matters right now.
For informational purposes only.