
Analyst Targets
- UBS — Buy, $149
- JP Morgan — Overweight, $145
- Stifel — Buy, $145
- Bernstein — Buy, $142
- Bank of America — Buy, $139
- BTIG — Buy, $140
- Wells Fargo — Overweight, $135
- Mizuho — Outperform, $135
Consensus sits at roughly $133. The bull case at $155 implies roughly 22% upside from Wednesday’s close near $126.75.
Opening
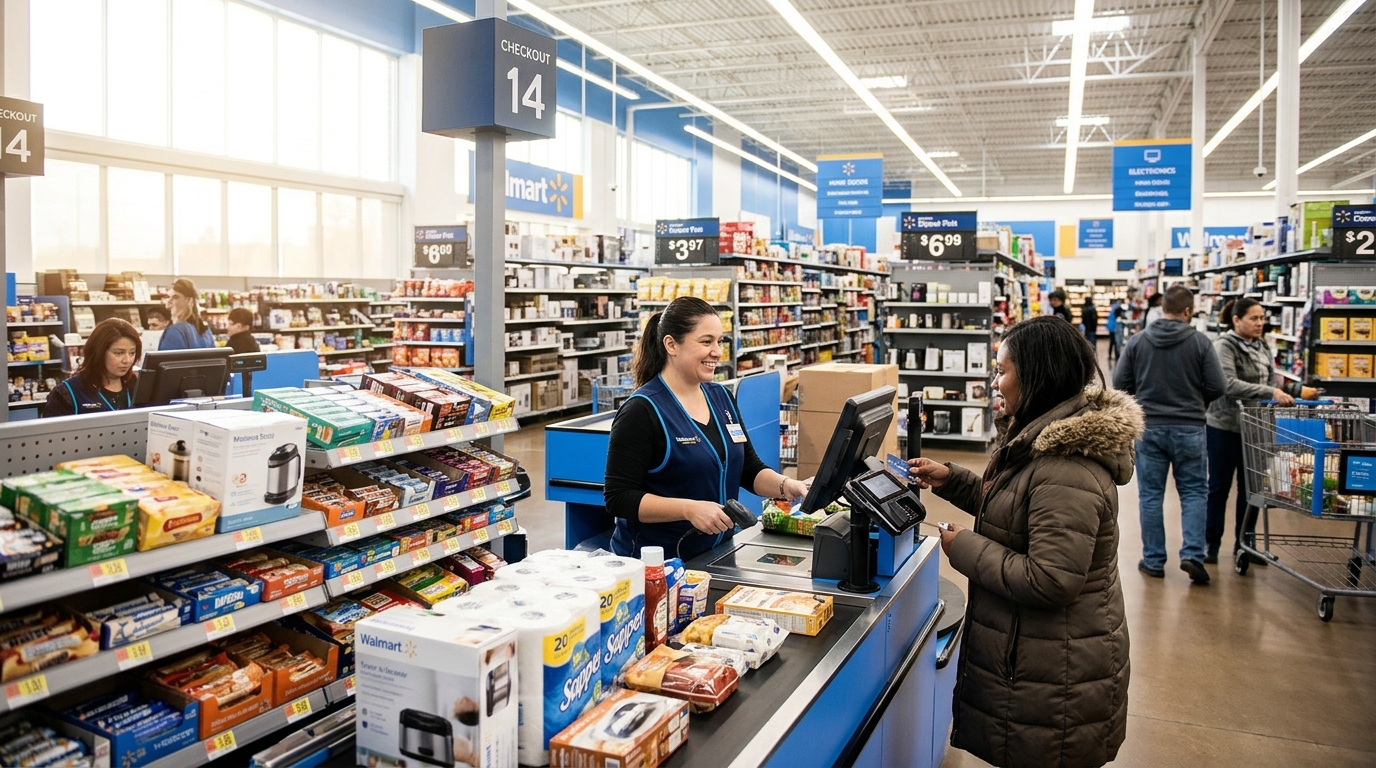
Walmart reports fiscal Q3 2027 results at 7am ET this morning. The number most investors will clock first: whether the company can hold the $0.64 EPS consensus on $187.3 billion of revenue, which is roughly in line with Visible Alpha consensus. After Home Depot, Target, Lowe’s, and TJX have all taken their turns in front of the consumer health question, Walmart is the last and heaviest read of the season.
The stock entered today slightly lower in premarket, slipping roughly 0.7%. That caution is not irrational. Last quarter, Walmart beat adjusted EPS estimates, and the stock still fell more than 9% on August 21, 2026, as investors punished guidance they found insufficiently ambitious for a company trading near the mid-40s multiple on forward earnings.
Company Profile
Walmart operates more than 10,900 stores and clubs and multiple ecommerce platforms across 19 countries, reaching approximately 280 million customers and members per week globally. Food and consumables account for roughly 60% of US sales, giving the company a structural traffic advantage that no pure-play retailer can replicate. That grocery foundation feeds a fast-growing advertising business, a marketplace platform, and a Walmart+ membership program that together are reshaping the company’s margin profile well beyond what headline revenue suggests.
The Numbers
What Wall Street expects this morning:
- Revenue: $187.3 billion (consensus), up 4.3% year over year vs. $179.5 billion in Q3 FY26
- Adjusted EPS: $0.64, against company guidance of $0.62–$0.64 and year-ago EPS of $0.62
- Walmart US revenue: $124.5 billion, up approximately 3.2%
- US comparable sales growth: 3.1% consensus; Piper Sandler at 3.2%
- Gross margin: 24.4% consensus, roughly flat with the prior year period
- Global ecommerce: online sales growth expected to remain above 20% year over year
- Advertising revenue: expected to grow at a healthy double-digit rate year over year
- FY27 EPS guidance range: $2.80–$2.87
The comparison base matters. Management guided Q3 FY27 operating income growth of 2–4%, well below the 17.4% adjusted operating income growth posted in Q2, in part because Walmart flagged that Q2 benefited from tariff refund timing and that investors should consider Q2 and Q3 together to assess underlying trajectory.
Why the Stock Moves From Here
The issue is not whether Walmart beats the number. It has beaten adjusted EPS estimates in seven of the past eight quarters. The issue is what guidance looks like for Q4 and whether the company can demonstrate that the Q2 margin expansion was structural and not a one-time tariff windfall.
Traffic counts and grocery share data are the specific variables the market is treating as proximate causes. Walmart is still the largest US grocer by sales, but estimates of its US grocery share vary by source and methodology, and recent industry trackers have put it closer to about 20% than 21%. Upper-income households driving incremental share gains, as management has highlighted this year, represent a durable shift. If that trend reversed in August through October, the valuation case cracks.
The upper-income shift Walmart is counting on has a parallel test elsewhere. American Express billed business data offers the most direct read on whether affluent consumers are still spending at the same rate.
The stock fell after three of Walmart’s last four earnings reports, even when EPS beat estimates. The pattern suggests what the market is actually changing each quarter is its view of forward operating income leverage, not the headline quarter itself.
Macro Context
October retail sales data released Tuesday delivered a 0.2% headline gain, with sales excluding autos climbing 0.6%. In that backdrop, the CME FedWatch tool has been showing odds near 95% for a December rate hike. That is the environment Walmart is reporting into: a consumer who is spending, but whose spending is concentrated in essentials, and a central bank that is not yet finished tightening. For Walmart specifically, that is often a favorable combination. It tends to gain share when wallets tighten.
The Flipkart timing shift is a known headwind. Management has flagged roughly 100 basis points of Q3 sales growth drag from moving Flipkart’s Big Billion Days from Q3 to Q4. International segment expectations reflect that, with Flipkart growth still expected to remain solid despite the comp drag.
Forward Scenarios
Bull
Revenue clears $188 billion, comparable sales come in at 3.5% or above, and Q4 guidance implies operating income growth that re-accelerates toward the Q2 pace. Advertising revenue confirms strong growth. The stock challenges the $132–$135 resistance zone that has held twice in 2026 and breaks through toward the $140–$149 range that the highest-conviction bulls are targeting.
Base
Revenue lands in line near $187.3 billion, EPS hits $0.64, comps print near consensus at 3.1–3.2%, and full-year guidance is maintained at $2.80–$2.87. The stock reacts modestly. Options are pricing a 6.3–6.6% move, well above the historical average, which means a flat reaction on a clean in-line quarter is itself a form of disappointment for volatility sellers.
Bear
Comparable sales miss at or below 2.5%, Q4 operating income guidance disappoints, and gross margin comes in below the 24.4% consensus. With the stock valued at roughly the mid-40s multiple on forward earnings, there is minimal cushion. A repeat of the August 21, 2026 reaction, when a clear EPS beat coincided with a more than 9% stock decline, is not off the table if Q4 guidance fails to justify the premium.
Technical Overlay
WMT closed Wednesday at $126.75. The $132–$135 zone is the defining resistance; the stock failed there in both February and May before falling to the $102–$104 area, then recovered to revisit the barrier in early November. The 52-week high of $135.16 is the level that, if cleared, confirms the report was received well. Support is at $106.50 on any sharp reversal. The stock is up roughly 23% over the past 52 weeks, so the chart already has a great deal priced in relative to where EPS estimates actually sit.
What Investors Should Watch
- US comparable sales: anything above 3.5% changes the guidance conversation
- Transaction growth vs. ticket growth: in Q2, transactions were up 1.5% and average ticket up 1.1%; a widening of the gap tells you whether the traffic flywheel is accelerating
- Advertising revenue growth rate: in Q2, Walmart reported Walmart U.S. advertising up 38%; any material deceleration would matter
- Gross margin delta: whether the Q2 tariff-driven expansion was a one-quarter event or the beginning of a new range
- Q4 and full-year guidance language: management’s tone on holiday spending and whether FY27 EPS guidance gets raised above $2.87
Bottom Line
Walmart trading near $1 trillion in market cap with earnings estimates that have barely moved in three months is a valuation that requires execution without stumbles. The question the market is actually asking this morning is not whether Walmart will earn 64 cents per share, but whether the company’s emerging businesses, advertising, marketplace, membership, are growing fast enough and profitably enough to justify paying a mid-40s multiple for a traditional retailer. The grocery traffic data and the Q4 holiday guidance are the two data points that will determine whether today is a breakout or another reset.